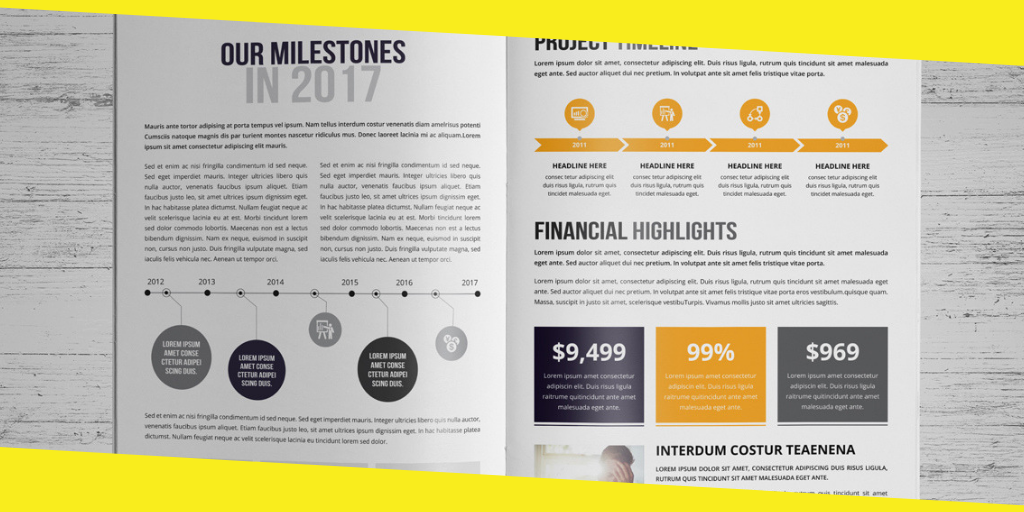
How To Design a Highly Engaging Report?
Whether you are a business, corporation or company, the reports of your data will always remain the most crucial part of the business.
The shareholder, investors, lender and a lot of other potential profit sources will use it as a reflection of your firm. Your reports will literally decide the popularity and the traffic that you attain for your business. It will have an undeviating impact on the growth of your business and the amount of investor you get.
Therefore, it is vital that your report is readable, engaging and can attract more readers.
The following are the thing that will help you to attain the goal and create a high-engaging report in no time. Have a look.
Contents
ToggleUse Design to Clarify Your Purpose
The report that you create must have a specific focal point. All its data and other content should set a view of this point and divert the readers to it. It should provide clarity about your motive behind creating the report.
You can achieve this goal by making the main title distinct from the other text, adding tag line all through the content and planning the design scheme of the report.
You have to make sure that the element of your report template may it be the color scheme, pictures or any other elements, emphasize the titles and tags. It will give them a bit more strength and attain more attention.

Visual Enhance the Content
The success of your report depends on the readability of the content. Even the report with the most useful content will fail to attract traffic if the readers find it difficult to figure out things.
The following are some sales report best practices that you can use to improve the readability of your report.
- Break up the content into short paragraphs
- Prefer bullet points over long sections
- Prefer justified text; readers often overlook centre aligned titles
- Use a decent size for proper readability of the text
- Use boldface to highlight important words
- Maintain high contrast between the main text and the background
- Avoid reverse out texts. It is difficult to read on the web and consume more ink for printing
- Use images and infographics to reinforce the main content
- Avoid using low-resolution pictures or infographics
- The material has to be 100% original
Apart from these measures, you can also prefer to use an online report maker tool to optimize the reports for better readability scores.
Use Clear Navigation
To establish the importance of your data, it is crucial that you provide a clear pathway for the reader. You have to ensure a smooth flow of the data and eliminate all the misleading or distractions.
So, try to use plenty of informative sub-headings for each part of the content. Combined with proper graphics, the sub-heading will improve the navigation of the report and make it easy to find the parts of personal interests. It will also make the report more flexible for skimming and helps orient people.
Some practices to create report with better navigate are:
- Use consistent page to page design features
- The formatting of text titles, bullets, labels and more, should remain constant throughout the report
- Consider using page numbers for easy navigation, especially in a printable report
- Provide persistent main heading links for quick navigation options
Consider Formatting the Whole File
The worst mistake that you can make in a report is to fit too much data on a single page. It makes the report look more messy and unappealing. Even with a proper font and text size, the reader will find it difficult to read an over-packed report and most probably avoid it.
Therefore, try to keep the layout clean and uncluttered. Adjust the size of your graphics and margin in such a way that the report looks spacey. In case you have arranged the data in columns, try to avoid the vertical lines.

Moreover, try to keep the alignment to one direction or justify it all. It will let the user know of the length of the lines and hence differentiate between different paragraphs.
The Final Words
After you have prepared and formatted the report for the appealing look you desire, identify its overall readability. In the case of a web report, you should also analyze the SEO performance of the report before sharing it.
It will let you know about the loopholes of the files and the changes you need for better online visibility.
Once have optimized the report according to all the above criteria, just upload it, and you will see how these minor changes and the SEO optimization will enhance the engagement rates of the report. You will be surprised by the results.
Recommended For You
How To Make The Perfect TV Ad
Most Inside
Most Inside offers high-quality recommendations and valuable updates to enhance all aspects of your life, providing premium guidance and enriching experiences.


